|
SPATIAL
AND TEMPORAL VARIATION IN RECRUITMENT TO ROCKY SHORES:
RELATIONSHIP TO RECOVERY RATES OF INTERTIDAL COMMUNITIES
Principal Investigators:
Peter Raimondi
and
Richard Ambrose
Summary of Research
Our general objective is to
understand the recruitment patterns of the dominant
space-holding organisms in the rocky intertidal and to
couple this understanding with information from our
ongoing monitoring of adult dynamics. This will
help us determine whether patterns of recovery will
occur over a broad spatial scale, be associated with
geographic "neighborhoods," or be unpredictable in
space. Ultimately this approach will allow us to
address our program goal: to be able to predict site
specific recovery rates following an oil spill or other
large scale disturbance.
We used the following criteria to select sites for this study:
1. Proximity to
existing monitoring plots. Only sites adjacent to MMS monitoring sites
were considered as candidates for this recovery study. This will allow
placing results in the context of historical species abundances.
2. High abundance of all four target species (Chthamalus fissus/dalli, Endocladia muricata, Silvetia compressa
and Mytilus californianus.)
This was determined qualitatively by assessing each potential site for
the target species.
3. Geographic distribution of sites such that one site would fall in
each of the three target biogeographic regions (North, near to and
South of Point Conception).
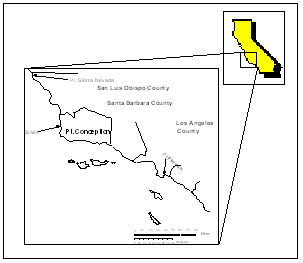
Using these criteria, Point
Sierra Nevada, Stairs and Point Fermin were selected as sites for this
recovery study (see Figure 1.)
Figure 1. Map of
sites where recovery plots were established. Note distribution of one
site North, near to, and South of Point Conception.
Experimental layout and initial sampling of Recovery and
Control plots.
At each site, 8 recovery plots
and 3 control plots were established in the Chthamalus, Endocladia, Silvetia and Mytilus assemblages (see Figure 2).
Figure 2.
Schematic drawing of Recovery (R) and Control (C) plots in each
assemblage.
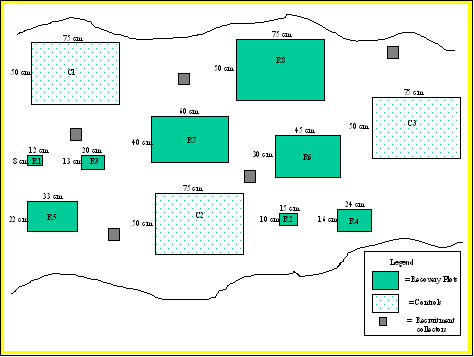
Plots ranged from 8 cm x 12 cm to
50 cm x 75 cm, with one plot of every size. Control plots were the size
of the largest clearing size, 50 cm x 75 cm. This is also the same size
as the MMS monitoring plots. The total area cleared in each assemblage
was approximately 1 square meter. A total of 44 plots were established
at each site (8 Recovery plots and 3 Control plots in 4 assemblages).
Length to width ratio was held constant for each size (approximately
1:1.5). Prior to clearing, every recovery plot was photographed and
sampled in two ways:
1. A Uniform Point-Contact method
was employed for each plot. The number of points in each plot reflected
the size of the plot to accurately capture the plot: 100 points for the
5 largest sizes, and 50, 40, and 30 points for the three smallest
plots. PVC "quadrats" were strung with fishing line to allow for the
greatest precision possible when sampling plots. Data were collected by
using a CSM 150 bar code scanner attached to a HandSpring handheld.
Species were identified to the smallest taxonomic level possible.
2. Mobile critters were counted in each plot. Limpets and littorines
were generally sub-sampled. Species were identified to the smallest
taxonomic level possible. Only investigators who were experienced
mobile counters (from either Shoreline Inventory or SWAT team)
collected the data.
Experimental disturbances
Experimental disturbances were
established in Recovery plots of all sites in late November - December
of 2003. All biota were removed using chisels, paint scrapers, wire
brushes and ice picks. All sites were cleared within 3 weeks of each
other. A propane torch was used to sterilize all plots to remove
microscope propagules.
All plots were photographed after they were cleared. Mussels, Silvetia
and mobile invertebrates from Pt. Sierra Nevada and Pt. Fermin were
collected and frozen.
Recruitment collectors
Recruitment collectors were
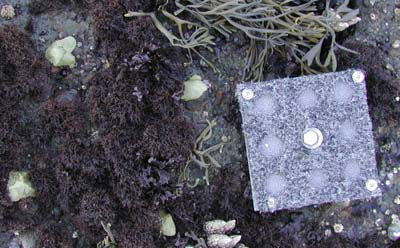
deployed at each site. Five safety-walk plates were put amongst the
barnacle plots (see Figure 3), 5 barnacle mimics in the Endocladia
plots (see Figure 4), 5 Endocladia mimics in the Silvetia plots (see
Figure 5), and 4 tuffies in the mussel plots (see Figure 6). In the
barnacle zone, a rock area (10 cm x 10 cm) adjacent to the collector
was cleared, in the Endocladia zone, Endocladia was removed from
barnacles adjacent to the barnacle mimics, and in the Silvetia zone,
Silvetia was removed from the Endocladia adjacent to the Endocladia
mimics. These plots were also 10 cm x 10 cm, the same size as the
collectors. At Pt. Fermin, where there was no Endocladia in the
Silvetia zone, the collectors were place adjacent to patches of
Caulacanthus ustulatus, a turfy red alga in which juvenile Silvetia
plants have been observed.
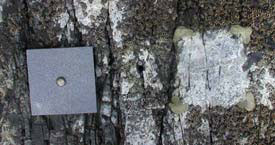
Figure 3. PVC plate covered with
Safety walk and recruitment clearing in Chthamalus zone
Figure 4. Barnacle mimic and Endocladia
recruitment plot in Endocladia zone.
(3)
 (4)
(4)
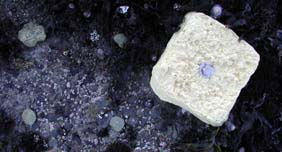
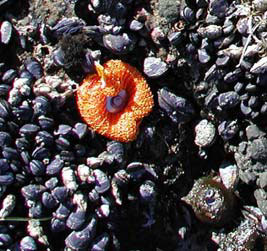
Figure 5. Silvetia
collector and Silvetia recruitment plot in Silvetia
zone.
Figure
6.
Mussel recruitment collector (“Tuffy”) in Mytilus zone.
(5)
 (6)
(6)
Initial trends - Recovery plots
Recovery plots were sampled (Pt.
Contacts, Mobiles and Photographs) in March 04 and again in June 04. Chthamalus recruits are present in
all sizes of all Chthamalus plots at all three sites. Endocladia has shown some
vegetative reproduction (encroachment) at all three sites. Barnacles
have also recruited into most Endocladia
plots. Two Recovery plots at Stairs have shown Endocladia recruitment into the
middle of the plot. As of the March sampling, there were no Silvetia or
Fucoid recruits in any of the plots. However, in the June sampling,
Fucoid recruits (<2 cm) were detected in some of the Recovery plots
at all three sites. Some mussel plots have shown varying degrees of
encroachment; no mussels have recruited into the plots.
Initial trends - Monthly
recruitment:
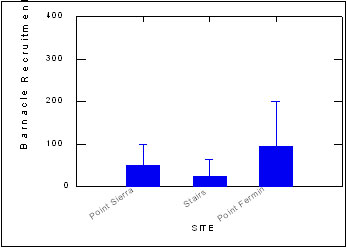
Barnacle recruitment data is
presented in Figure 7. Point Fermin and Point Sierra Nevada have showed
higher mean monthly recruitment from January to May than Stairs .
Figure
7.
Mean monthly barnacle recruitment (± SD) at Point Sierra Nevada, Stairs
and Point Fermin from January 2004 to May 2004.
|
[homepage]
|
[overview]
|
[researchers]
| [students
& staff]
|
[research] | [download
reports]
|
|