|
ECOLOGICAL
PERFORMANCE AND TROPHIC
LINKS: COMPARISONS AMONG PLATFORMS AND NATURAL REEFS FOR SELECTED
FISH AND THEIR PREY
Principal Investigators: Mark Page
(UCSB),
Jenifer Dugan (UCSB), Milton Love
(UCSB), and Hunter Lenihan
(UCSB)
Summary of Research
 One of the major
issues in the disposition of decommissioned oil platforms is the need
for research that assesses the quality of platforms as habitat for
ecologically and commercially important invertebrates and fishes.
The primary goal of this project is to explore whether indices of
ecological performance (e.g., nutritional condition, size, individual
growth) of a model fish and its invertebrate prey differ between
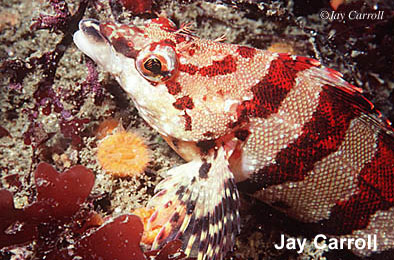
platforms and natural reefs. We selected the painted greenling (Oxylebius pictus) as our model
fish. It is one of the few fish species found on every surveyed
oil platform and natural reef in the Santa Barbara Channel
region. They are territorial and thus have limited movement among
locations. Invertebrate prey of painted greenling consist
primarily of small amphipod crustaceans, but may also include small
gastropods, polychaetes, and other invertebrates (see below).
During the study, we sampled potential invertebrate prey monthly at two
natural reefs (Naples, Mohawk) and two offshore oil platforms (Holly,
Houchin). Painted greenling were sampled from these locations in
September 2003 and April 2004. One of the major
issues in the disposition of decommissioned oil platforms is the need
for research that assesses the quality of platforms as habitat for
ecologically and commercially important invertebrates and fishes.
The primary goal of this project is to explore whether indices of
ecological performance (e.g., nutritional condition, size, individual
growth) of a model fish and its invertebrate prey differ between
platforms and natural reefs. We selected the painted greenling (Oxylebius pictus) as our model
fish. It is one of the few fish species found on every surveyed
oil platform and natural reef in the Santa Barbara Channel
region. They are territorial and thus have limited movement among
locations. Invertebrate prey of painted greenling consist
primarily of small amphipod crustaceans, but may also include small
gastropods, polychaetes, and other invertebrates (see below).
During the study, we sampled potential invertebrate prey monthly at two
natural reefs (Naples, Mohawk) and two offshore oil platforms (Holly,
Houchin). Painted greenling were sampled from these locations in
September 2003 and April 2004.
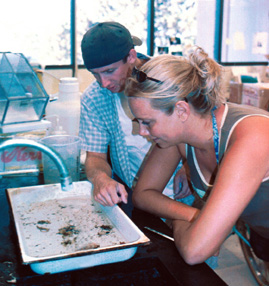
 Samples of
invertebrates are collected within randomly placed 20 x 20 cm quadrats
along transect lines at a depth of ~ 9 m using a combination of
scraping and vacuum sampling. On return to the laboratory, prey
items are separated from non-prey material that commonly includes turf
forming algae and, from the platforms, mussels and other
macroinvertebrates. The major non-prey components of the benthic
habitat in each sample, such as the benthic algae, are also quantified
in terms of weight or volume. Following this coarse processing,
prey items are identified, counted and weighed, and for some taxa
measured. These data will allow us to compare the standing crop,
composition, and perhaps production of potential prey Samples of
invertebrates are collected within randomly placed 20 x 20 cm quadrats
along transect lines at a depth of ~ 9 m using a combination of
scraping and vacuum sampling. On return to the laboratory, prey
items are separated from non-prey material that commonly includes turf
forming algae and, from the platforms, mussels and other
macroinvertebrates. The major non-prey components of the benthic
habitat in each sample, such as the benthic algae, are also quantified
in terms of weight or volume. Following this coarse processing,
prey items are identified, counted and weighed, and for some taxa
measured. These data will allow us to compare the standing crop,
composition, and perhaps production of potential prey among locations. To date, we have processed 625
samples of invertebrates taken at the four locations. In addition
to the field sampling, we are comparing the “instantaneous” molt rate
and molt increments of caprellid amphipods, important prey items of
painted greenling, among locations. Caprellid amphipods are
maintained individually in the laboratory following sampling, and the
number of individuals that molt from each location is recorded over
three consecutive days. The molted exuvia and newly molted animal
are measured to determine the molt increment of each individual that
molts. These data may permit a comparison of individual growth,
one component of production, of these amphipods among locations. among locations. To date, we have processed 625
samples of invertebrates taken at the four locations. In addition
to the field sampling, we are comparing the “instantaneous” molt rate
and molt increments of caprellid amphipods, important prey items of
painted greenling, among locations. Caprellid amphipods are
maintained individually in the laboratory following sampling, and the
number of individuals that molt from each location is recorded over
three consecutive days. The molted exuvia and newly molted animal
are measured to determine the molt increment of each individual that
molts. These data may permit a comparison of individual growth,
one component of production, of these amphipods among locations.
Our data to date indicate that the total
density and taxonomic composition of potential invertebrate prey of
painted greenling differ greatly among platform and reef locations
(Fig. 1). Total densities of small invertebrates were more than
an order of magnitude higher at Platform Holly than the other locations
and were frequently the lowest at Mohawk Reef. The invertebrate
assemblage at the platforms and Naples Reef is dominated numerically by
gammarid and caprellid amphipod crustaceans. The species
composition of caprellid amphipods, important prey items of painted
greenling, differ among locations with an large invasive species
(up to 18 mm) Caprella mutica
comprising 61% of the assemblage at Holly, but <10% at the other
locations (Table 1).
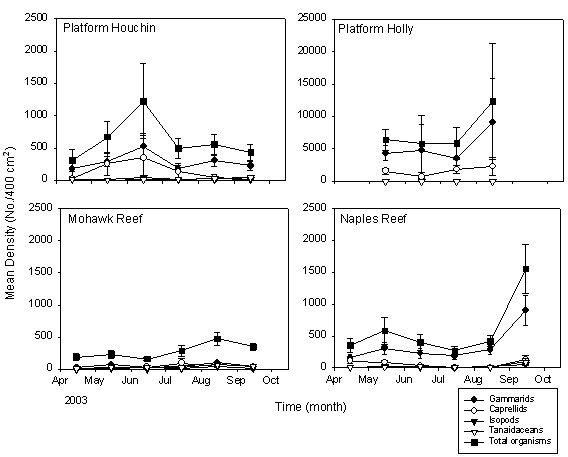
Figure
1. Mean density (±1SE)
of major groups of organisms over time at platform and natural
reef study locations. n=8 to 12 quadrats/location in each month.
Note variable scales on y-axis.
The ecological performance of painted greenling is being
compared across locations through measurements of the quantity and
quality of prey items consumed (number and types of prey in the stomach
and overall weight of stomach contents) and the nutritional state of
the fish (condition factor, K). Painted greenling are collected by hand
in the same area that invertebrates were sampled, injected through the
mouth with formalin to preserve the stomach contents, and returned to
the laboratory for processing. In the laboratory, each fish is
measured (standard length) and weighed. The stomach from each
fish is removed and the contents weighed, identified, and counted.
Preliminary
data from fish sampled during September 2003 show that painted
greenling at all locations were feeding primarily on gammarid and
caprellid amphipods (Figure 2). There also appears to be the
selective ingestion of caprellid amphipods over other types of prey;
caprellid amphipods were present in stomach contents at
disproportionately higher frequencies than their relative abundance at
each location. This pattern was particularly evident at Mohawk
Reef and Platform Holly. The condition of painted greenling (estimated
as K) varied among locations and appeared related, at least in part, to
the availability of amphipod prey; values of K were
Table 1.
Species composition of caprellid amphipods (Caprella spp. as percent of total)
at the platform and natural reef locations. Data are the %
contributed by each species to the total weight of fish prey sampled
on each platform (these data are from samples processed to date).
Caprellid Species
|
Location
|
C. californica
|
C. verrucosa
|
C. equilibra
|
C. mutica
|
|
Naples Reef
|
28.0
|
22.2
|
46.6
|
2.7
|
|
Platform Holly
|
1.0
|
<1.0
|
37.1
|
61.0
|
|
Mohawk Reef
|
62.7
|
18.7
|
17.6
|
0.5
|
|
Platform Houchin
|
4.2
|
5.3
|
81.0
|
8.1
|
 substantially
higher for fish at Platform Holly compared to fish from the other
locations (Figure 3). This site also had the highest
abundance of prey species, indicating K may be influenced by food
availability for the model fish. However, an unknown “location
effect” may be present as well since K is similar at Mohawk and
Platform Houchin, but prey availability is higher at the
platform. We have initiated a laboratory experiment to directly
test the effects of prey abundance, species composition, and
microhabitat structure (which also differs among our sites) on fish
feeding rates and condition index. This experiment will help us
better understand the variation observed in K-value of fish and its
relationship to prey population dynamics across POCS platforms and
natural reefs. substantially
higher for fish at Platform Holly compared to fish from the other
locations (Figure 3). This site also had the highest
abundance of prey species, indicating K may be influenced by food
availability for the model fish. However, an unknown “location
effect” may be present as well since K is similar at Mohawk and
Platform Houchin, but prey availability is higher at the
platform. We have initiated a laboratory experiment to directly
test the effects of prey abundance, species composition, and
microhabitat structure (which also differs among our sites) on fish
feeding rates and condition index. This experiment will help us
better understand the variation observed in K-value of fish and its
relationship to prey population dynamics across POCS platforms and
natural reefs.
To complete the study,
we will develop estimates of standing crop and production of these prey
taxa at each location, process samples of painted greenling taken in
April 2004 for stomach contents and condition factor, and conduct
experiments on fish feeding behavior to link prey and predator
performance.
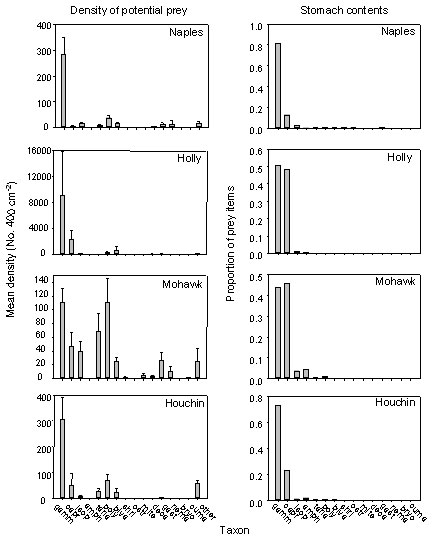
Figure 2.
a) Density of invertebrates in August 2004 at Naples and Mohawk Reefs
and Platforms Holly and Houchin by taxa and b) proportion of prey items
by taxa in the stomach contents of painted greenling sampled at these
same locations in September 2004. Key: gamm=gammarid
amphipod, capr=caprellid amphipod, isop=isopod, amph=unk amphipod,
tana=tanaidacean, poly=polychaete, biva=bivalve, shri=shrimp,
ostr=ostracod, deca=decapod, gast=gastropod, nema=nematode,
bryo=bryozoan, cuma=cumacean
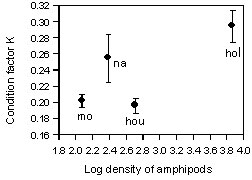
Figure 3.
Condition factor (“K”)of painted greenling versus the log density of
gammarid and caprellid prey at Platforms Houchin (hou) and Holly (hol),
and Mohawk (mo) and Naples (na) Reefs.
 Another objective of our study is to
estimate the total possible production of fish and invertebrate prey
on POCS platforms and rocky reefs using the ecosystem-trophic
interaction software provided by ECOPATH/ECOSIM. The general goal
of our modeling is to estimate how much fish biomass can be produced on
POCS oil platforms versus natural rocky reefs through predation on
populations of common fish prey species. We will use the fish and
prey species abundance data collected in our monthly surveys, growth
rates of painted greenling approximated from our field sampling data,
growth rates of prey species determined in our laboratory experiments,
and feeding rates recorded from our laboratory experiments in our models once these results are
available. Another objective of our study is to
estimate the total possible production of fish and invertebrate prey
on POCS platforms and rocky reefs using the ecosystem-trophic
interaction software provided by ECOPATH/ECOSIM. The general goal
of our modeling is to estimate how much fish biomass can be produced on
POCS oil platforms versus natural rocky reefs through predation on
populations of common fish prey species. We will use the fish and
prey species abundance data collected in our monthly surveys, growth
rates of painted greenling approximated from our field sampling data,
growth rates of prey species determined in our laboratory experiments,
and feeding rates recorded from our laboratory experiments in our models once these results are
available.
|
[homepage]
|
[overview]
|
[researchers]
| [students & staff]
|
[research] | [download
reports]
|
|